Scenario Neutral Approach: What could be the best supply policy under climate change?

Fig. 1. Severe drought damage occurred in Boryeong Dam, 2015: (a) before; (b) after the drought
Figure 1 shows Boryeong Dam before and after the 2015 drought, with the water level reaching the bottom. Domestic drought damage is expected to become more common as a result of climate change.
Existing climate change studies based on GCM scenarios have been shown to have biases due to model selection and downscaling techniques. Thus, a scenario-neutral climate change study that covers a broader range of climate variability in a bottom-up manner can be an alternative approach.

Fig. 2. Boryeong Dam's supply reliability under scenario-neutral inflow and demand scenarios. The K-water operation rule is compared to a simple hedging rule and a genetic algorithm-based hedging rule.
Figure 2 depicts the results of Boryeong Dam's supply reliability under three scenarios: low demand, status quo, and high demand. The higher the stability, the lower the total value.
To compare with the K-water operation rule, two additional rules are generated: a simple hedging rule and a genetic algorithm-based hedging rule.
Intricate issues of stakeholders (government, private organization, supplier, etc.) that may arise in terms of water management will be addressed from a neutral standpoint in future research, and multi-later decision-making that can minimize social conflict will be discussed using game theory.
Assessing drought resilience: Prioritizing existing drought response options

Fig. 3. Protests against dam construction: (a) Hantangangdam, Gangwon-do; (b) DaedeockDam, Gyeongsangbuk-do.
Drought mitigation can be done by increasing the water supply fundamentally, decreasing water demand, relocating water resources, or minimizing drought damage through drought response measures. These drought response measures can be classified as structural or non-structural.
However, due to public opposition to the dam's environmental impact, it is not possible to construct new water facilities. Thus, an examination of existing non-structural measures (water supply adjustment, linked operation, and use of emergency capacity) is required to determine the conditions under which each drought measure is appropriate.

Fig. 4. S-day results of four dams: (a)Boryeong dam; (b) Buan dam; (c) Daecheong dam;(d) Yongdam dam. Return period 20 to 50 year drought.
Figure 4 depicts the length of time needed to reach the low water level (S-day) when a specific return period of drought events continues. Here, KDM stands for the drought inflow generation method proposed by Korea Water Corporation (K-water).
To identify drought resilience across a wide range of drought conditions, multi-year drought series were generated by using the Multivariate Periodic AR (MPAR) model.
Also, the limitation of the former K-water Cumulative Difference Method for estimating drought inflows was theoretically quantified.
Finally, the drought resilience capacity of 15 multi-purpose dams and water supply dams in Korea was evaluated. Drought mitigation measures were prioritized for each dam, and optimal capacity for each drought mitigation measure was also suggested.
Development of drought information for public awareness: Survey and map visualization

Fig. 5. Sample of the survey took by farmer living in Jeollabuk-do, Korea.
Various institutions in Korea are currently producing drought information and indices, but it is presumed that public awareness is relatively low. It is necessary to develop drought information that can persuade people to easily and quickly sense the severity of the drought so that appropriate drought-response actions can be implemented (e.g. joining water saving campaign).
People perceive drought differently depending on where they live and what they do. As a result, the actual drought information should be considered from a social science perspective.
Here, we organized two citizen advisory groups and conducted surveys: (1) residents of metropolitan cities experiencing hydrologic drought and (2) farmers experiencing agricultural drought (Fig. 5).

Fig. 6. Drought information visualized on the web-based map.
The region's water profile was first investigated in order to select a drought that can best represent the region's damage. The drought index was then weighted based on the ratio of municipal, industrial, and agricultural water use in each region.
This drought index was visualized on the web-based map by using the Folium library in Python (Fig. 6). The region's drought severity is displayed in color, the drought response message appears when the mouse is hovered over, and the drought level for each water is set to appear when clicked.
Korea Climate Change Assessment Report 2020

Fig. 7. Korea Climate Change Assessment Report 2020.
The outcomes of future climate change projections vary depending on which GCM or RCM, downscaling methods, and scenarios are used. As a result, it would be helpful to gather and analyze ensembles of climate change simulation results in order to provide a level of agreement in favor of decision-making. A total of 168 academic literature concerning domestic climate change and water resources research published from 2014 to 2019 were examined.
The results' agreement level were divided into three categories: substantial agreement, moderate agreement, and restricted agreement. The substantial agreement is the findings with the high agreement and robust evidence. Moderate agreement indicates the findings with the medium agreement or high agreement with low evidence. Lastly, the restricted agreement shows the findings with the low agreement and limited evidence.

Fig. 8. Agreement levels of future projection results in Korea are given.
The annual precipitation has generally increased, whereas the summer rainfall has increased, along with the frequency of extreme rainfall over the past thirty years with Substantial Agreement.
The maximum rainfall, probable rainfall, design rainfall, and extreme rainfall were also projected to increase. Therefore, future discharge tends to increase in general, particularly in summer with a Moderate Agreement.
Both the frequency and intensity of future flooding were likely to grow with the Moderate Agreement.
Moreover, the frequency and scale of drought will generally increase in the future. Furthermore, drought damage was projected to exacerbate especially in the Han River and the southern part of the country.
With the change in the rainfall pattern, both flood and drought damage are expected to increase in Korea.
The long-term variability of the upper-level jet stream and turbulence potentials associated with climate change
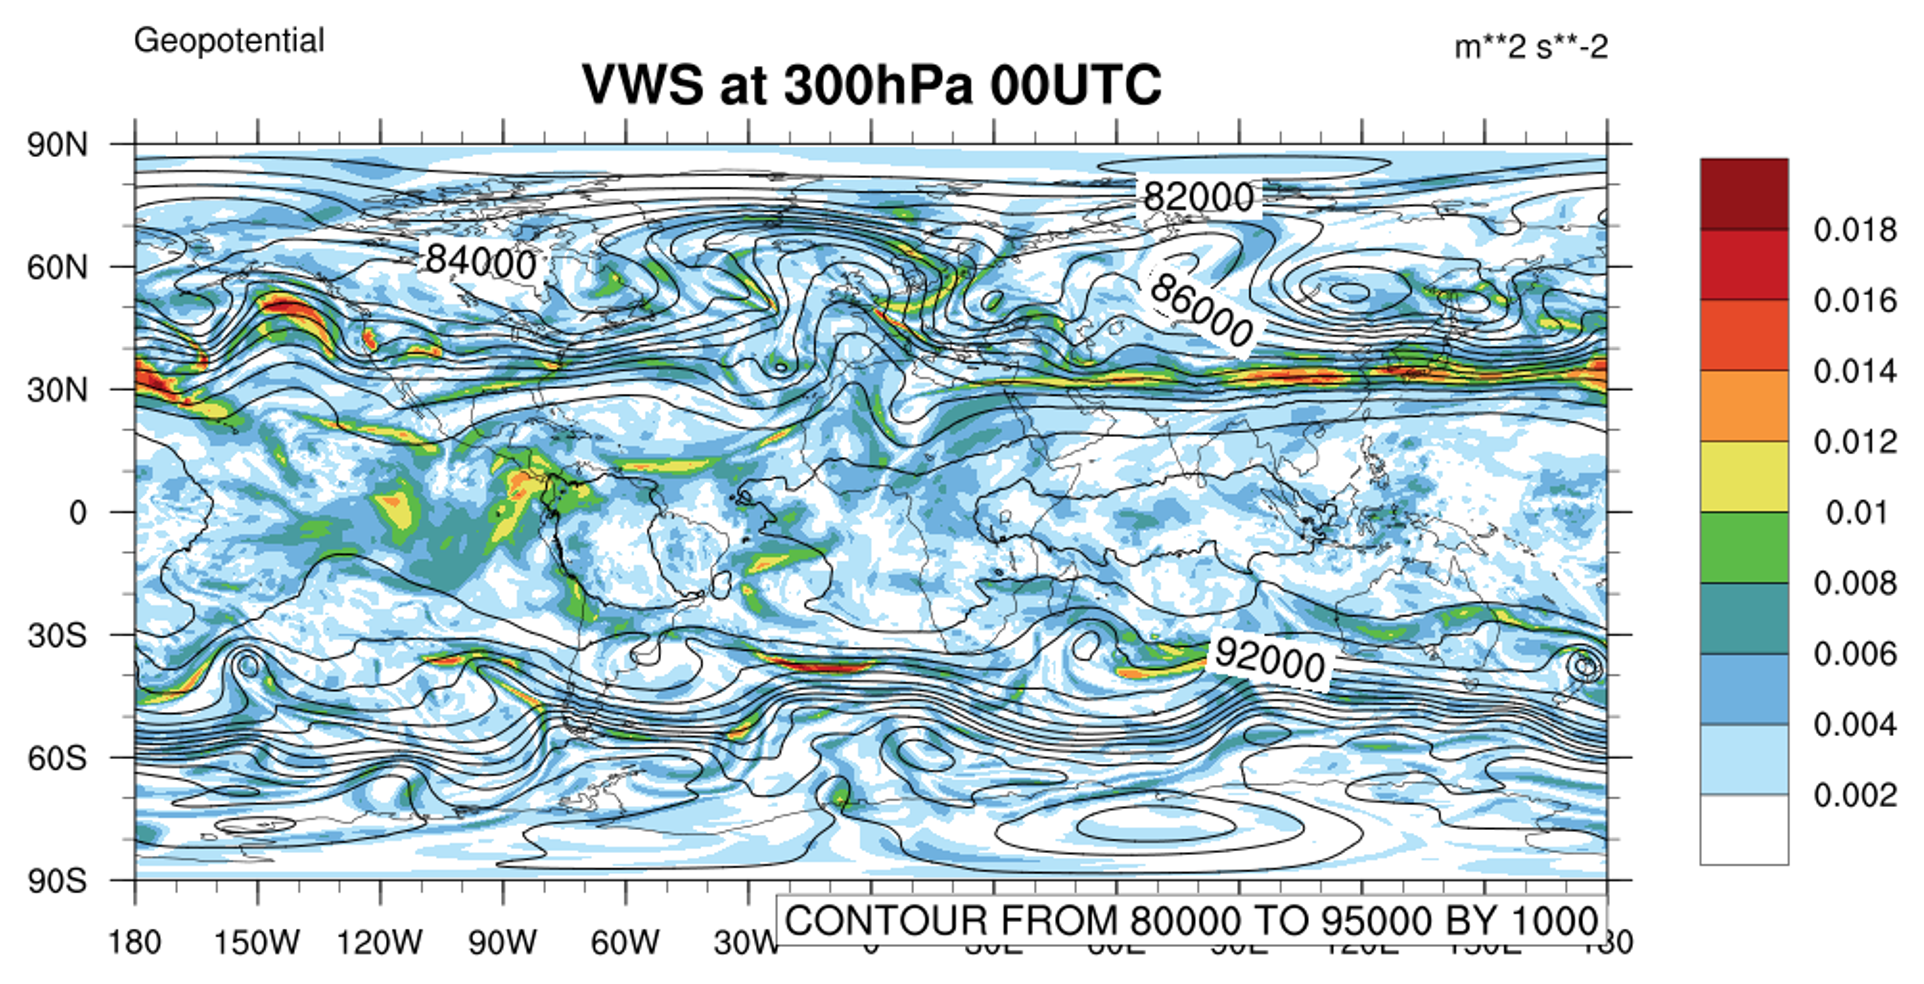
Fig. 9. Vertical Wind Speed at 300 hPa in winter to calculate TI.
Clear Air Turbulence (CAT) is turbulence that occurs at altitudes of 5.6 km or higher in clear, cloudless skies, is closely related to jet streams, and is most commonly observed in the mid-latitudes. Because turbulence can have a negative impact on an aircraft's safety, such as the possibility of a crash, identifying its trend is critical for both the aviation industry and passenger safety.
CAT is strongly related to vertical wind shear and deformation, as well as convergence. Furthermore, because turbulence is caused by instability, we diagnosed each of the three instabilities (Kelvin-Helmholtz, Hydrostatic instability, and Symmetric instability) using Ri, N2, and PV, with TI serving as an empirical index (Fig. 9).
The turbulence index was calculated using NCAR Command Language (NCL) for ERA5 Reanalysis data from 1978 to 2019.